Home › What’s covered › Data Desert
Data Desert
Data Desert covers statistics: reading pictograms, tally charts, tables and bar charts in Years 3 and 4, then line graphs, timetables, pie charts and the mean in Years 5 and 6.
Charts are drawn clearly with simple scales, and hints show exactly where to look.
Years 3 and 4: getting started
The Year 3 and 4 skills. Younger children start here, and older children can use them for a recap.
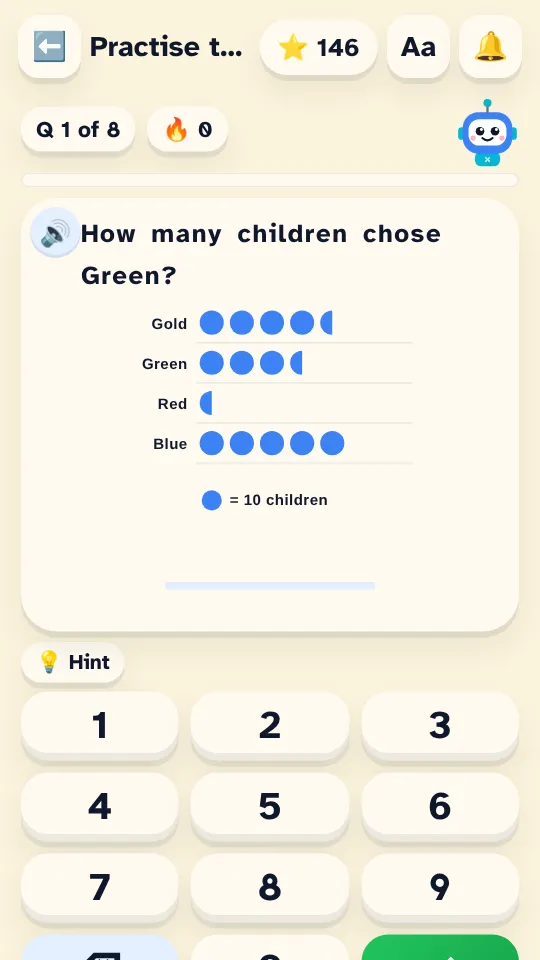
Pictograms
Look at the key first. Each picture stands for more than one. Half a picture is half as many.
- reading a row
- how many more?
- how many altogether?
Simple bar charts
Go to the top of the bar, then read across to the scale.
- read a bar
- how many fewer?
- most popular
Tally charts and tables
Tally marks go in fives: four lines, then one across. Count in fives, then the rest.
- count the tally
- read a table
- add up a row
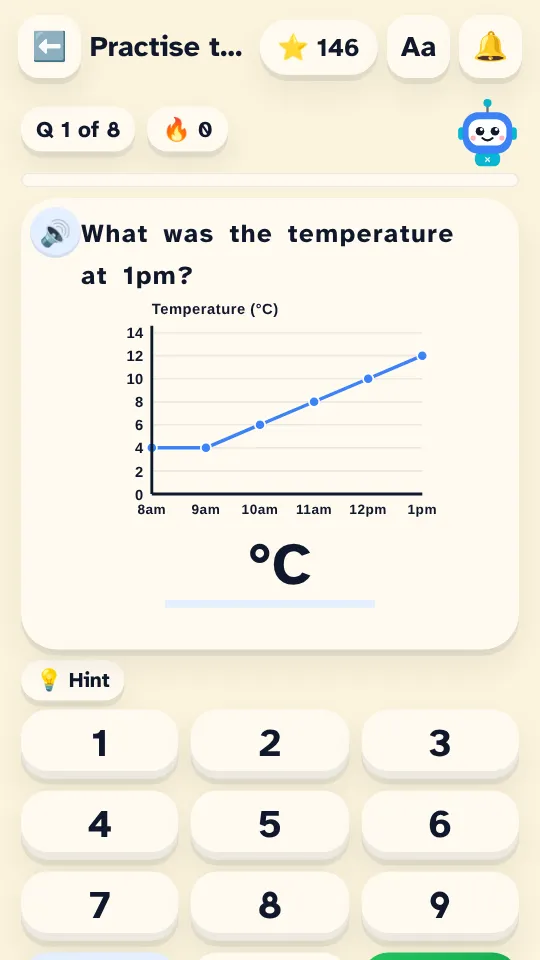
Time graphs
A time graph shows how something changes during the day. Find the time along the bottom, then read up.
- read a time
- how much warmer?
- when was it hottest?
Years 5 and 6: next steps
The Year 5 and 6 skills, building up to the KS2 SATs.
Reading tables
Find the right row and the right column. Then do the maths.
- adding along a row
- finding a difference
- which is most
Timetables
Each column is one bus. Read down the column to follow that bus.
- how long is the journey
- what time does it arrive
- which bus to catch
Bar charts
Read across from the top of the bar to the scale. Check what each line on the scale is worth.
- reading a bar
- between the lines
- more, fewer and totals
- most and least
Line graphs
Find the time along the bottom. Go up to the line. Read across to the scale.
- reading a value
- between the lines
- how much did it change
- biggest rise
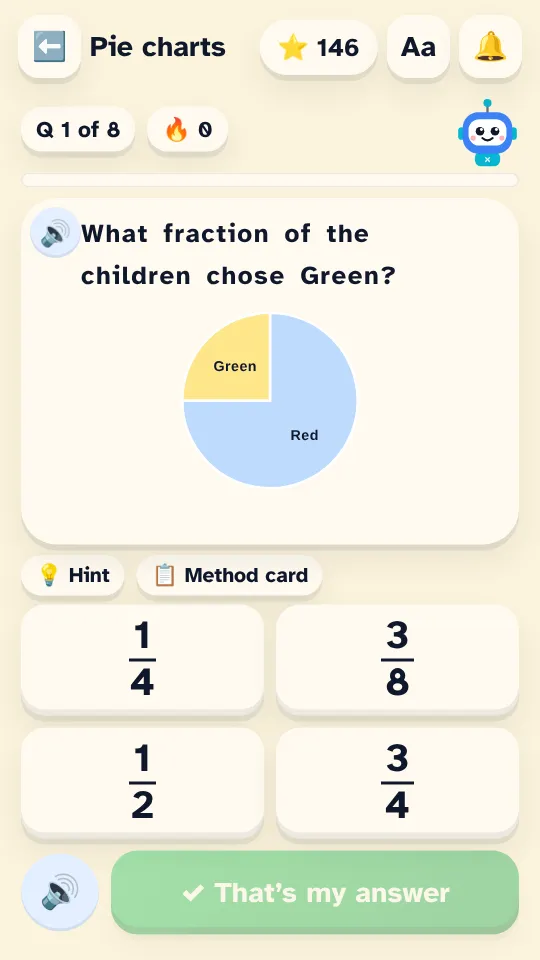
Pie charts
The whole circle is everyone. Half the circle is half of them. 360° is the whole circle.
- what fraction
- how many people
- using angles
The mean (average)
Add all the numbers up. Then divide by how many numbers there are.
- find the mean
- find a missing number
Data problems
Word problems about data. Use Break it down to plan.
- mean scores
- total from the mean
- sales and money
How Data Desert works
- A short, no-pressure quick check finds the right starting point. It isn’t a test.
- Every question can be read aloud, and hints show a picture first.
- Each level has its own boss battle, unlocked once your child has had plenty of practice.
- Practice is untimed.